Google Analytics Tips & Tricks 2020
In this article, we’ll be discussing how you can get the most out of Google Analytics with this tips and tricks in 2020.
Measuring the performance of your website is critical to understanding where your web traffic is coming from, their travel path, and their drop off point is. Google Analytics provides all this information and more. Having this information may seem a bit daunting to understand at first, but it definitely is a lot simpler than it seems. What’s great about Google Analytics, not only how powerful it can be, but also completely free.
There is still a surprising amount of people that fail to use Google Analytics properly. Whereby skimming through the results is the “norm” and only really looking at the site visit metrics.
This is a huge mistake since we can learn a lot more from Google Analytics. We have compiled a list of tips and tricks that could help you deep dive into your most valuable asset and provide insight into your visitors. So, let’s get started
Visitor Flow Chart
The visitor flow chart is not something seen mentioned in Analytics, not everyone cares exactly how their visitors interact with their website, but this information is much easier to follow.
Under Audience > Users Flow is where you can find this information.
The first part “Starting Pages” is the landing page where each user landed on first. The blue lines then indicate connecting pages where they went to from that particular landing page. Studying this flow to map out which page is most likely to be visited next is crucial.
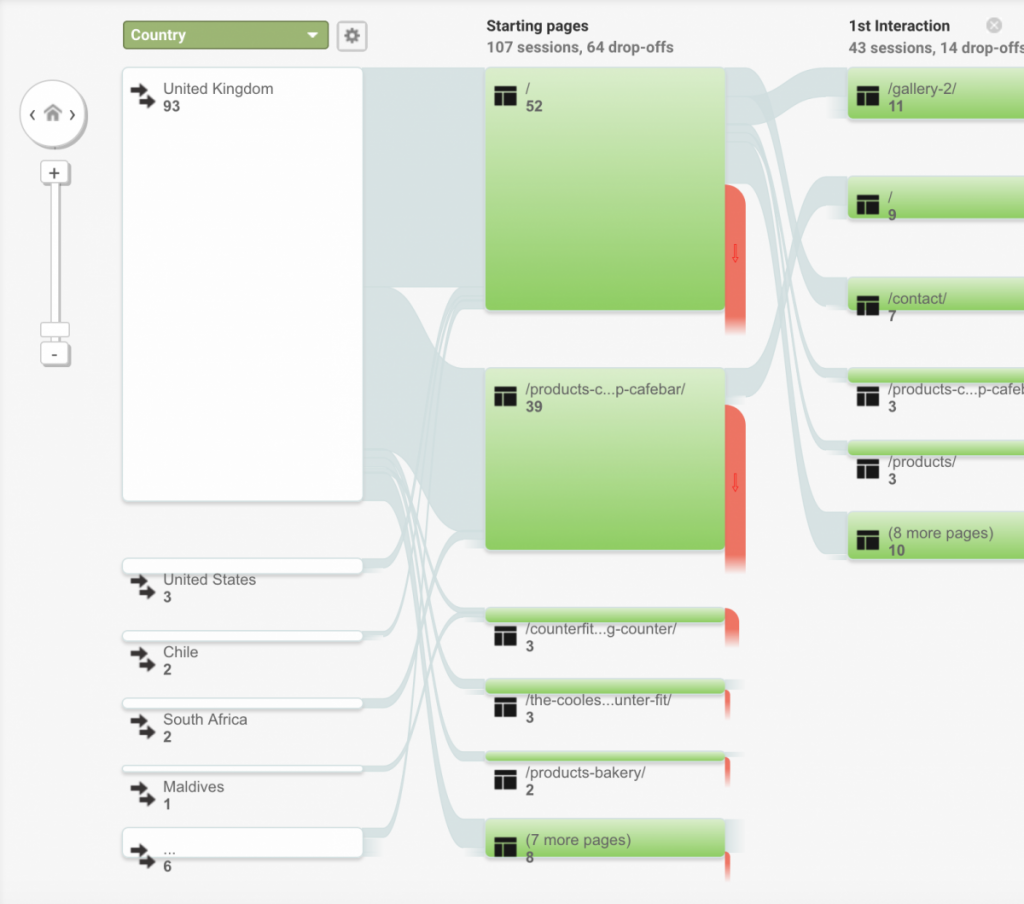
At first glance you may feel overwhelmed but the graphs are meant to be a bit messy. Thicker lines run through each block if there are more users following the same route. This could be visitors landing on a popular blog post then it leads them to your homepage.
Understanding these patterns of your users will amplify your ability in replicating the effects on similar content across your website.
Understanding HTTP Latency
You might not know it, but your website loading speed is so important to your end users, even if they realise It themselves. With the ever-changing speeds of the internet and ISP providers, data can be transferred seamlessly and quickly.
This means, if your web server becomes bottlenecked with the influx of visitors, web pages can take forever to load. This leaves your visitors not only frustrated, but also leaving a bad experience embedded into their mind.
Within Google Analytics you can see an overview of your website’s speed by going to: Behaviour – Site Speed – Overview
This will help you determine what areas need improving, especially in the Page Timings graph. This area details each page (in seconds) the average webpage takes to load.
Check it out yourself in Behaviour > Site Speed > Page Timings
If you have a lot of pages with images or video content, this may take longer to load than a basic blog post based on text and fewer images. You will have to consider the amount of information in a wider sense to figure out where problems arise.
A technique that can hurt your speeds is linking third-party JS and CSS libraries, this may save time, but left to their own devices can actually hurt your website. So, keep an eye on these and monitor religiously
Understanding your Exit Pages
It’s quite common to be fixated on the highest visited pages. However, understanding what drives your traffic away is important. Analytic data is great for picking this out. Having a page with 80% exit rate isn’t great, having an understanding of, why your users are not interested is key in making sure your Exit Page rating drops.
To find out your Exit Page data can be found here: Behaviour – Site Content – Exit Pages
If you find your bounce rate is quite high for pages such as blog posts, then this isn’t uncommon for a user to find what they’re looking for and then exit off without browsing your website. This just means they’ve found an answer to question they’ve put into Google and job done; off they go.
You shouldn’t get caught up in finding a “fix” for a high bounce rate on certain posts / pages. This requires a bit of common sense unfortunately and knowing yourself what pages should have a high bounce rate and the ones that shouldn’t. A product or service page with a high bounce rate is bad. A blog post with a high bounce rate, not so much. So, take bounce rate with a pinch of salt.
Backlinks & Referrals
Reviewing your referral stats both short-term and long-term can help you figure out which websites are sending you visitors. You will most certainly want to check how engaged this traffic is to your website by seeing how long they stick around and how many other pages they visitor.
This information can be found in: Traffic Sources > Sources > Referrals
Social networks like Reddit have a large source of traffic to web developers and graphic designers and is great in some cases for of referral traffic. Platforms like Reddit, have communities based around anything you can think of, like programming, graphic design, tech support and the like.
There can be a situation where traffic comes from a website that you did not publish on. Think of things like affiliate links, other blog posts where someone else has added a link to your website or post from their own page.
Creating Goals
Creating goals is one of the basic and simplest features of Google Analytics. You can choose from numerous templates but, the main area for most websites is the conversion goal. Creating a goal based on conversions, you are able to monitor and check important KPI this way.
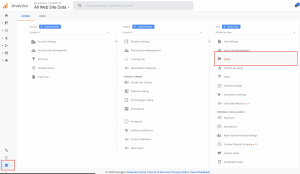
Within Google Analytics there are four ways to track goals:
- URL Destination. This goal keeps a track of specific URLs on your website. Each time your specified URL is visited, the goal is then triggered.
- Visit Duration. This goal tracks how long visitors stay on your website for a specific amount of time that you can set. It can also track visits that lasted the least amount of time that you specified.
- Page/visit. These goals are similar to the Visit Duration, except it tracks a number of pages the user visits before dropping off the website.
- Event. With these goals, you can set an event first, from clicks on an ad, downloads, external links, clicks on a video and the time spent watching videos and so on. Creating an event is basically any type of interaction a user has with your content.
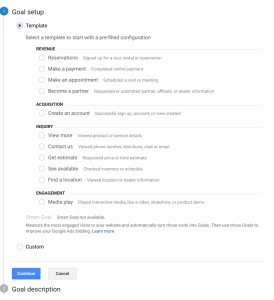
Creating goals is an important element for tracking metrics of your website. The thing that you should be tracking include:
- Leads
- Newsletter signups
- eBook / document downloads
- the amount of accounts created
- And anything else that generates you revenue from your website.
Conclusion
This isn’t a comprehensive, you must do this, type of list, but hopefully we have highlighted a few niche areas for you to look at within your own Google Analytics account.
It never hurts to spend time looking into the data Google Analytics provides, this will help with building a strategy in solving UI problems and create a solid focus for your visitors.
Feel free to take a look at our other posts on our website that might help you on your journey to ranking higher on Google.

